Valuation
A Guide to Comps and Precedents
In this article
Comparable companies analysis and precedent transactions analysis are straightforward. You find a set of public comparable companies (comps) or a set of precedent M&A transactions (precedents) that are similar to your target. Then you use a range of multiples derived from those comps or precedents to value your target company. The hard part is (1) picking the right comps and precedents and (2) scrubbing and gathering the data.
Selecting Comps and Precedents
The standard criteria for both comps and precedents are industry, financials, and geography. For industry, it’s ideal for comps / precedents to be competitors of the target. It’s not sufficient that a company serves the same end market as your target. Different parts of the same supply chain can have very different market characteristics (e.g., book writing is a highly competitive market but book publishing is an oligopoly), leading to different valuations. For financials, the most common metrics for comparison are size (enterprise value and revenue usually), revenue growth, and profitability (EBITDA margins usually). Geography is a common criterion because business environments and market conditions vary greatly across countries, which often directly translate into valuation differences (US vs. European companies are the clearest example of this; e.g., European banks trade at a large discount to US banks).
Precedent transactions have an added criterion of recency: a transaction that occurred five years ago is unlikely to be a useful reference as the market environment has changed dramatically since then. Precedent transactions ideally occurred within the last 1-2 years.
On rare occasions, other criteria beyond industry / financials / geography have similar or even greater importance in identifying comps or precedents, such as structure and regulation. For example, perhaps our client is selling a minority stake to a certain government, and the deal involves highly unusual and complex terms. Say there have only been two other cases in the past where this government has done such a thing. Those two other cases are going to be the most valuable precedents, not regular minority stake sales within the same industry as our client.
A quick note on multiples. This article uses EV / EBITDA everywhere because it’s the most common multiple in comps and precedents work. It’s not the only option: EV / Revenue is the fallback when EBITDA is negative, and some industries have their own conventions. The selection logic and the scrubbing work are the same no matter which multiple you use.
Pros and Cons
Comps and precedents analyses share many of the same pros and cons: current market sentiment (pro and con), connection to real-world prices (pro and con), and company comparability (con). Comps have a benefit over precedents of always being current: there is usually no risk of data being stale given the public companies’ regular disclosures (the exception is thinly-traded stocks1). But precedents include control premiums, which make them more useful for advising on majority-stake M&A.
Compared to comps and precedents, the DCF has two issues: it’s largely agnostic to the current market environment and is detached from the prices people actually pay. A DCF can have assumptions that lead to valuations wildly detached from the real world (prices anyone has ever paid) and from the current market environment (prices someone would pay today). The sensitivity of comps and precedents to these things is important but not a purely good characteristic.
If market valuations today are detached from fundamentals (whether valuations are too high or too low), then eventually valuations will return to some more normal level. In an exuberant market, comps will provide a correspondingly exuberant valuation for your target. Precedents reflect the conditions of the times they occurred: if all your precedents are from a year where valuations were depressed but the public peers have since had a recovery in valuation, the precedents likely don’t reflect current market conditions.
The biggest flaw of comps and precedents, though, is that no two companies are the same. Meanwhile, the DCF is almost entirely inherent to your target2. Comps and precedents are relative valuation points that compare companies with differences in scale, profitability, strategy, capital allocation, culture, geographic footprint, and other important characteristics. This problem is amplified when there are no good comps or precedents, and in the case of precedents, when there are no good recent precedents.
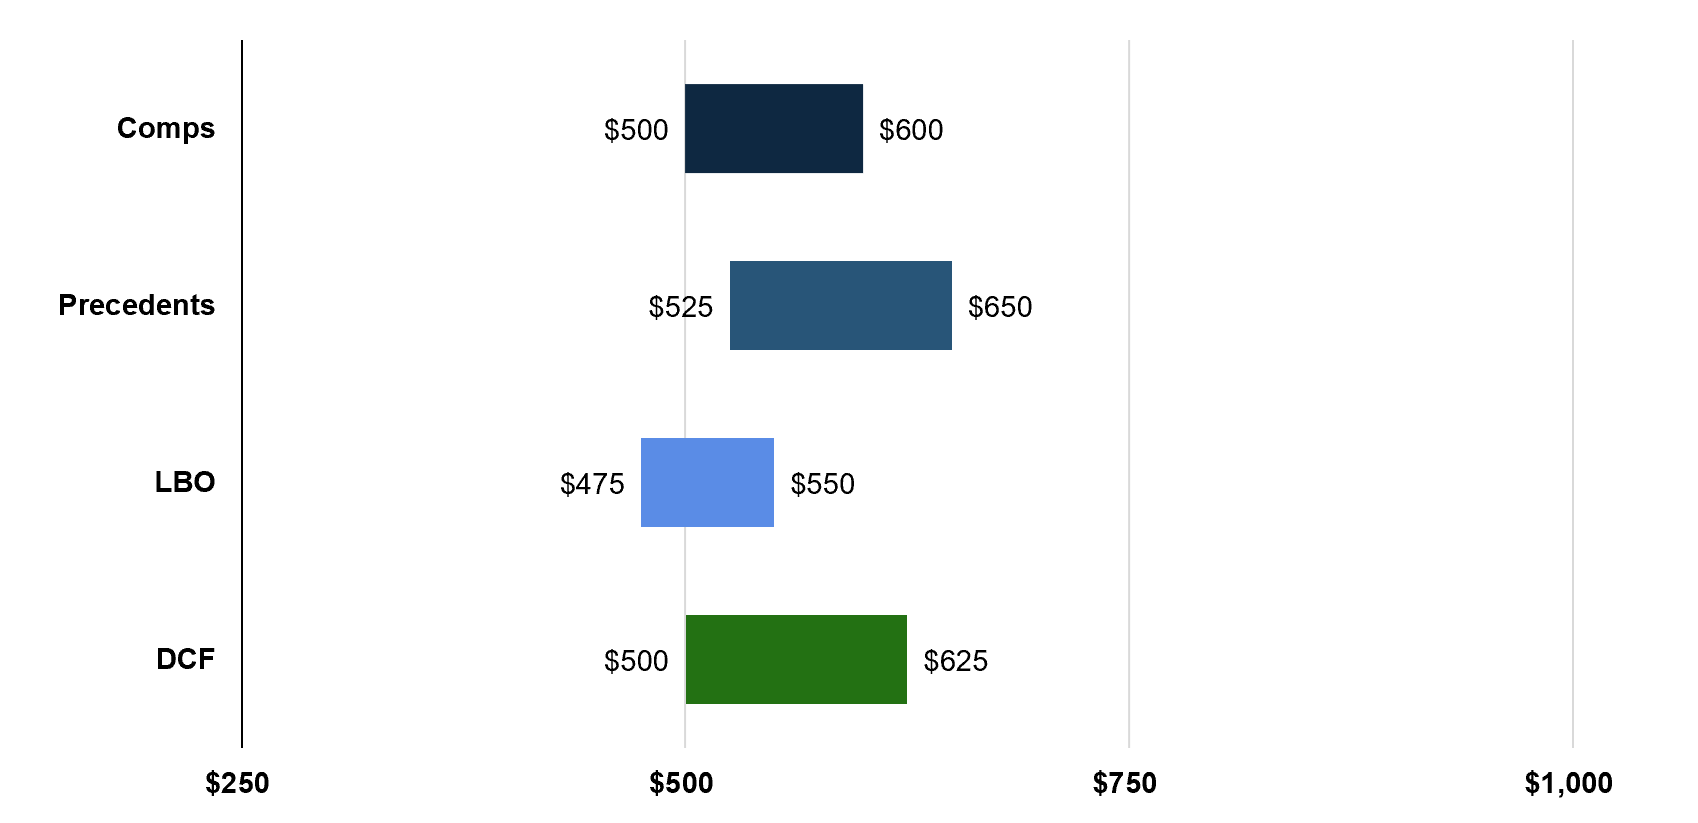
Every valuation method has its flaws. This is why valuations are presented as ranges and with a variety of methodologies in a football field chart (example below).
The Control Premium
The control premium is a critical concept to understand for precedent transactions. It’s often understood as the additional price you pay to acquire a controlling stake in a company. This is most obvious for public companies: when a public company is acquired, the share price the acquirer pays is typically 20-30% higher than the pre-announcement price (assuming no acquisition rumors / information leaks). Control premiums exist for two key reasons. The first is that existing shareholders must be persuaded to sell their stake. Existing shareholders expect an attractive return on their stake in the acquired company, otherwise they wouldn’t own it (and would instead buy something else). So to convince them to let go of their shares, the acquirer needs to make the price attractive. The second reason is that voting rights on their own have value. If you own 50.1% of the voting rights, you can do almost anything you want with the company, including the most important changes: replacing the board and management.
Synergies are not why control premiums exist, but they are how acquirers pay for them. Say a target has $50M of EBITDA and the acquirer expects $10M of annual cost savings from combining the two companies. The acquirer can pay a premium on $50M of standalone EBITDA because it’s really buying something closer to $60M. The premium gets funded by value the target could never have created on its own. This is also why premiums vary so much between similar deals: a competitive auction full of strategic bidders (each pricing in their own synergies) produces a very different premium than a negotiated sale to a single financial buyer with none. Two nearly identical companies can sell at very different multiples for reasons that have nothing to do with the companies themselves.
A key insight necessary to understand the control premium is that voting rights don’t have to be proportional to economic rights. The best example of this is dual-class share structures. Say Class A shares are only owned by the co-founders. Class B shares are owned by everyone else. Class A shares and Class B shares have identical economic rights. A Class A share and a Class B share receive the same dividends. But Class A shares have 10x more voting power. The founders own 11% of the company (11% of the economic rights) but have 55% voting rights of the company3. They control the company. Would you pay more money for a single Class A share or a single Class B share? The answer is obviously the Class A share. The difference is the control premium.
The textbook answer is binary: majority acquisitions include a control premium and minority stakes don’t (valuation practice often goes further and applies a discount to minority stakes for their lack of control). Give that answer in an interview. But the dual-class example shows the binary isn’t quite right: voting rights have value at any stake size. A 40% block that controls a company with otherwise dispersed shareholders can command a premium. So can a 5% strategic stake that comes with board seats. Practitioners tend to call these block or voting premiums rather than control premiums, and they’re smaller than the premiums for 50%+ stakes, but they exist. Not many interviewers test this nuance, but a few do, and it’s worth knowing.
Getting in the Mud
Comps and precedents analyses are straightforward, not easy or fast. Companies have unusual events not associated with their actual performance (e.g., a big divestiture, a one-time restructuring charge, or simply bad data). With public companies, you have enough information to adjust the numerator or the denominator (or both) of valuation multiples for these unusual events. For example, a company might trade at $800M EV and have $80M of LTM EBITDA. It appears to trade at 10x LTM EBITDA, but if the $80M of EBITDA includes $20M of EBITDA from a divested segment, you need to adjust down LTM EBITDA to $60M (because it’s extremely unlikely any investor is giving them any credit for the earnings of a segment that is no longer part of the business). That means the actual LTM multiple is ~13x.
With private companies, you generally can’t do such adjustments because of a lack of information but have a bigger problem: you often lack any information at all. It’s not possible to do analysis if you don’t have data. Therefore analysts spend a lot of time digging online and through internal files to find information on precedents.
The numerators and the denominators should be consistent when trying to derive a valuation range. So we cannot use LTM EBITDA for Precedent A and then NTM EBITDA for Precedent B. We cannot use EV inclusive of lease liabilities for Public Peer A but use EV exclusive of lease liabilities for Public Peer B. Everything should be apples-to-apples when deriving a valuation range.
Logically, though, we can have one valuation range that uses LTM EBITDA and another valuation range that uses NTM EBITDA. A senior banker will generally make a decision to use one or the other for a client presentation, but they may want to see both before making that decision. A caveat for precedents is that forward estimates are generally not available for private companies, so you are most likely to lean on historical financials like LTM EBITDA (the main case where forward financials are available is if all / most of your precedent targets were public companies).
All of the above is easier to understand with a concrete example.
PantherCo Example
We are trying to value PantherCo, our client and a privately-owned water treatment company with $20m LTM EBITDA and $22m NTM EBITDA. They are exploring a controlling stake sale.
In this example, there exist three public peers and three precedent transactions. In reality, you would likely have more for each group.
| Public Peer | Enterprise Value | LTM EBITDA | NTM EBITDA | EV / LTM EBITDA | EV / NTM EBITDA |
|---|---|---|---|---|---|
| AT Company | $1,100 | $100 | $105 | 11.0x | 10.5x |
| JOT Company | $700 | $70 | $80 | 10.0x | 8.8x |
| MDK Company | $600 | $60 | $65 | 10.0x | 9.2x |
| Median | $700 | $70 | $80 | 10.0x | 9.2x |
| Mean | $800 | $77 | $83 | 10.3x | 9.5x |
| Low | $600 | $60 | $65 | 10.0x | 8.8x |
| High | $1,100 | $100 | $105 | 11.0x | 10.5x |
| Precedent Target | Enterprise Value | LTM EBITDA | NTM EBITDA | EV / LTM EBITDA | EV / NTM EBITDA | Acquirer | Date |
|---|---|---|---|---|---|---|---|
| BM Corp | $325 | $25 | $35 | 13.0x | 9.3x | WaterCo | July 2026 |
| NS Corp | $300 | $30 | n/a | 10.0x | n/a | WaterCo | October 2025 |
| TB Corp | $250 | $20 | n/a | 12.5x | n/a | H2oCo | July 2025 |
| Median | $300 | $25 | $35 | 12.5x | 9.3x | n/a | n/a |
| Mean | $292 | $25 | $35 | 11.8x | 9.3x | n/a | n/a |
| Low | $250 | $20 | $35 | 10.0x | 9.3x | n/a | n/a |
| High | $325 | $30 | $35 | 13.0x | 9.3x | n/a | n/a |
Our public peers are much larger than our client, and all of the precedents are aligned to the client in size. More importantly, our client is (1) a private company and (2) selling a controlling stake; a precedent transactions analysis is more relevant to our situation. The comps provide a useful reference but are unlikely to provide our primary anchor for value.
Among our precedents, only BM Corp has an NTM multiple, making the mean and median calcs pointless, as using them would be misleading.
A realistic outcome from this output is an MD says “let’s use the range from NS Corp to BM Corp’s LTM EBITDA multiples.” So the value for PantherCo using that methodology is $200M to $260M ($20M times 10x, and $20M times 13x).
Next Steps
The best way to understand comps and precedents analyses is to do it yourself. The best way to structure this is as a case study: find one public company you would like to value. Then find the comps and precedents, scrub / gather data, and calculate a valuation range.
Sometimes companies name their competitors in their 10-Ks (a good source of comps and precedents). Good sources of precedents include fairness opinions (included in merger proxies), merger agreements, and data providers like FactSet. Equity research is a good source for both comps and precedents.
Footnotes
- Thinly-traded stocks (typically small-caps) can trade so infrequently that stock prices can get stale vs. what someone would actually pay now. ↩
- “Almost” because (1) most importantly, if you use the exit multiple method, then terminal value is dependent on market valuations and (2) the risk-free rate and equity risk premium are determined by external factors. ↩
- The founders’ 11 shares × 10 votes = 110 votes, vs. 89 votes for everyone else, so they hold 110 of 199 total votes (55%). The denominator grows too — supervoting shares inflate the total vote count. ↩